 March 19, 2021
Drew Ackermann and Preston Jutte contributed to this article.
It’s been a year since offices across the country turned off the lights and shut the doors for what started as a two-week shutdown to try to control the spread of COVID-19. The Gorove Slade team left our offices with laptops in hand and made the commute home. Two weeks turned to three, then to four, and eventually after moving the return to office date a few more times, everyone settled into the indefinite reality. Water cooler conversations moved to Teams, happy hours were held over Zoom, and commutes were measured in steps instead of miles.
The DC region has long held a reputation for long commutes, congested roads, and expensive fares. The 2019 State of the Commute Survey from the National Capital Region Transportation Planning Board found that the average commute time was 43 minutes. Although 60% of respondents said they commuted by driving alone, solo vehicular trips had fallen 9% between 2007 and 2019.
Pre-pandemic figures in the American Public Transportation Association, Public Transportation Ridership Report show that Metrorail ridership had increased 8.35% from Q4 2018 to Q4 2019. From the same report, WMATA saw an overall 2.32% year to date increase in ridership compared to 2018. Other regional transit started to see increases in overall ridership in Q4 2019 including Maryland MTA, Prince George’s County TheBus, Montgomery County Ride-On, Arlington Transit (ART), Virginia Railway Express (VRE), and PRTC’s OmniRide.
The impact of the abrupt switch to telework for much of the workforce was immediately felt on transportation in the area. The Greater Washington Partnership conducted a survey that revealed 41% of respondents were teleworking, 43% commuting by private car, and 7% via public transportation as of January 2021. Their Capital COVID-19 Transit Tracker allows users to toggle between pre-COVID capacity and current capacity with social distancing of WMATA Metrorail. The average number of passengers per car for the Union Station Metro station was 101 at its pre-COVID daily peak. Currently, the peak averages out to 18 passengers per car for the same station.
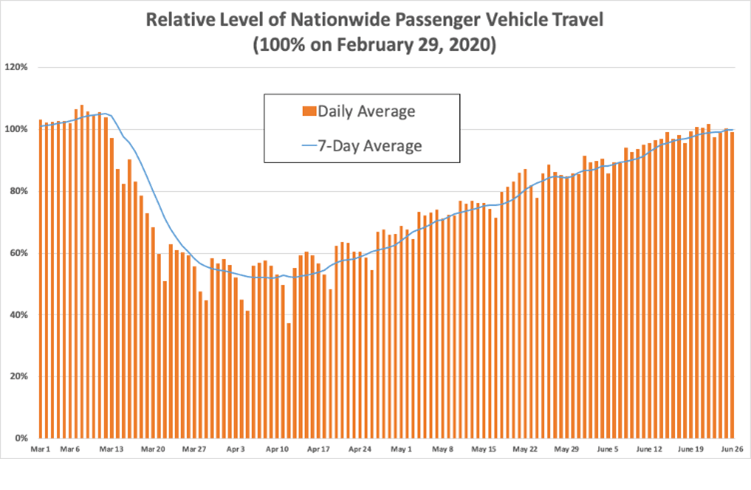
INRIX U.S. National Traffic Volume Synopsis Issue #15 (June 20 – June 26, 2020)
INRIX, a company that collects and analyzes traffic data, reported that passenger vehicle travel dropped nationally a year ago. The national numbers rebounded to pre-pandemic levels on June 25th after 15 weeks. As of January 2021, traffic volumes in the Washington metropolitan area are reported at 75% – compared to 92% nationwide – of what they were in January 2020. The total number of collisions dropped across the region’s highways with I-395 and US-15 seeing a 41% drop in collisions.
The drop in vehicles on the road was not all good news. Despite a decrease in vehicle miles driven across the Washington metropolitan region by the end of 2020, the Washington Post reported a 4% increase in traffic fatalities over the same period, attributed in part to excessive speeding.
As it became clear the pandemic wasn’t going away anytime soon, local governments began responding with transportation changes to accommodate a socially distanced way of life. The District Department of Transportation (DDOT) implemented its Slow Streets and Car Free Lanes programs, as well as sidewalk extensions and restaurant pick-up zones. Slow Streets restricted thru traffic to give space for individuals walking, running, or cycling to maintain social distancing. Car Free Lanes similarly gave space for cyclists and allowed for WMATA and DC Circulator buses to operate efficiently while reducing passenger crowding. “Streateries,” or partial street closures to accommodate outdoor dining, popped up all over the region, from the District, to Montgomery and Prince George’s Counties in Maryland, to Fairfax City, Fairfax County, Alexandria, and Arlington County in Virginia.
These changes were implemented across various phases of reopening we’ve experienced over the last year. We’ve reached a place where vaccines are being distributed and many believe that a return to normal is coming. INRIX reports personal vehicular travel nationwide has largely returned to pre-pandemic levels whereas WMATA is still reporting significantly fewer Metrorail and Metrobus riders. In January 2021, daily riders were down on average 85% for rail and 57% for bus compared to last year. The lack of rebounding public transportation numbers might be influenced by a continued reliance on teleworking.
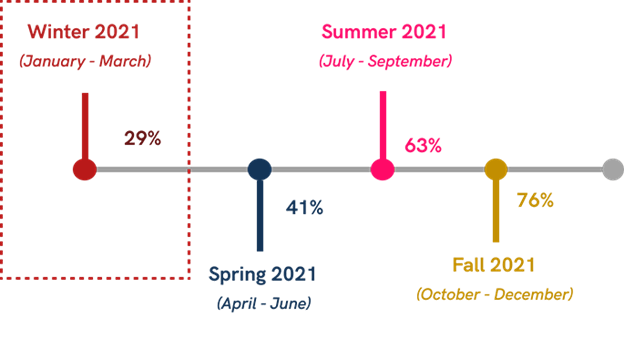
Greater Washington Partnership, Share of Workforce Expected Onsite Over the Next Year
Kastle’s Back to Work Barometer measures the average occupancy rate of commercial properties in metro areas. The swift drop from last March hit an all-time low of 12% in April 2020 and as of March 3, 2021 was only up to 21%. This suggests the majority of downtown offices are not in use at this time. The Greater Washington Partnership conducted a survey in August that found employers expected 29% of their workforce to return by March 2021. The timeline continues to increase the expectation of an in-person workforce to 76% by Fall 2021.
PwC, a global consulting firm, published their US Remote Work Survey which found 86% of employers intended to have the majority of workers back in the office by October 2021 while only 73% of employees expected the majority to return by then. The transition to primarily working from home has been met with mixed reviews. The split in opinion seems to carry over to teleworking after the pandemic is over. Pew Research Center’s “How the Coronavirus Outbreak Has – and Hasn’t – Changed the Way Americans Work” reported that 54% of employed adults would prefer to continue working from home post-pandemic.
This unprecedented year has perhaps left us with more questions than answers about the state of transportation in our region. Will “streateries” become permanent fixtures in our neighborhoods? Could slow streets and car free lanes continue to provide safer roads for people walking and biking? When will commuters return to transit and will those that have discovered cycling and walking to be socially distant stay with that mode? If teleworking proves popular, will real estate trends shift away from office space? What will the transportation landscape look like in the next year?
Without a doubt the pandemic will have a lasting impact on the way we work, how we commute, and how we use the public realm. Our sense from the data and what we hear from clients and our own team is that the virtual office is not a complete replacement for in-person collaboration and human interaction. We anticipate a return to the workplace, but likely with more flexibility which only helps to manage demands on our transportation network. As we move forward, we at Gorove Slade will continue to actively follow the changes the pandemic has on transportation patterns in our region and what this means for our projects.
References:
2019 State of the Commute Survey from the National Capital Region Transportation Planning Board
American Public Transportation Association, Public Transportation Ridership Report
Greater Washington Partnership, Capital COVID-19 Snapshot: Planning for the Return to Worksites
Greater Washington Partnership, Capital COVID-19 Transit Tracker
INRIX U.S. National Traffic Volume Synopsis Issue #15 (June 20 – June 26, 2020)
WMATA Covid-19 Public Information
Kastle’s Back to Work Barometer
Capital Region Kastle Back to Work Barometer
Pew Research Center, How the Coronavirus Outbreak Has – and Hasn’t – Changed the Way Americans Work